미적분 값 계산하기
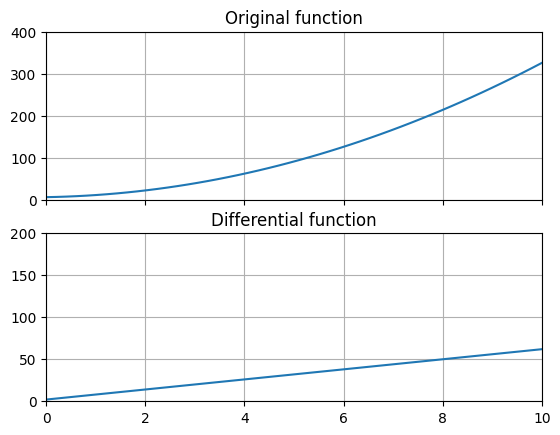
함수의 미분

 1import matplotlib.pyplot as plt
 2import numpy as np
 3
 4
 5def f(x):
 6    return 3 * x ** 2 + 2 * x + 6
 7
 8
 9def g(func, x):
10    y = []
11    h = 0.01
12    for _x in x:
13        y.append((func(_x + h) - func(_x)) / h)
14    return np.array(y)
15
16
17if __name__ == "__main__":
18    x = np.linspace(0, 10)
19    ax1 = plt.subplot(2, 1, 1)
20    ax1.set_title("Original function")
21    ax1.set_xlim(0, 10)
22    ax1.set_ylim(0, 400)
23    ax1.axes.xaxis.set_ticklabels([])
24    ax1.plot(x, f(x))
25    ax1.grid(True)
26    ax2 = plt.subplot(2, 1, 2)
27    ax2.set_title("Differential function")
28    ax2.set_xlim(0, 10)
29    ax2.set_ylim(0, 200)
30    ax2.plot(x, g(f, x))
31    ax2.grid(True)
32    plt.savefig("EX1_function_differential.png", bbox_inches='tight')
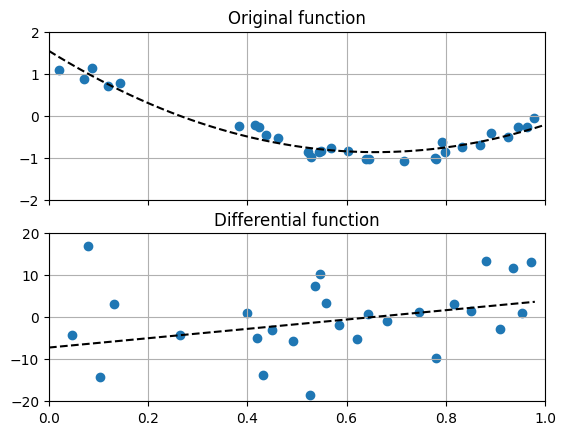
데이터의 미분량

 1import os
 2
 3os.chdir(os.path.abspath(os.path.dirname(__file__)))
 4
 5"""데이터의 미분량
 6소스코드의 실행 디렉토리와 데이터파일의 디렉토리가 일치하도록 조정
 7"""
 8import numpy as np
 9import matplotlib.pyplot as plt
10
11x = []
12y = []
13
14with open("data.csv", "r") as f:
15    for line in f.readlines():
16        _x, _y = [float(i) for i in line.split(" ")]
17        x.append(_x)
18        y.append(_y)
19
20
21def g(x, y):
22    new_x = []
23    new_y = []
24    for idx in range(len(x) - 1):
25        new_x.append((x[idx] + x[idx + 1]) / 2)
26        new_y.append((y[idx + 1] - y[idx]) / (x[idx + 1] - x[idx]))
27    return new_x, new_y
28
29
30if __name__ == "__main__":
31    fit = np.poly1d(np.polyfit(x, y, 2))
32    fit_x = np.linspace(0, 1)
33    fit_y = fit(fit_x)
34
35    # 그래프 1: 원시데이터
36    ax1 = plt.subplot(2, 1, 1)
37    ax1.set_title("Original function")
38    ax1.set_xlim(0, 1)
39    ax1.set_ylim(-2, 2)
40    ax1.axes.xaxis.set_ticklabels([])
41    ax1.plot(fit_x, fit_y, "k--")
42    ax1.scatter(x, y)
43    ax1.grid(True)
44
45    # 그래프 2: 미분한 데이터
46    ax2 = plt.subplot(2, 1, 2)
47    ax2.set_title("Differential function")
48    ax2.set_xlim(0, 1)
49    ax2.set_ylim(-20, 20)
50    ax2.plot(fit_x[:-1], np.diff(fit_y) / (fit_x[1] - fit_x[0]), "k--")
51    ax2.scatter(*g(x, y))
52    ax2.grid(True)
53
54    plt.savefig("EX2_data_differential.png", bbox_inches='tight')
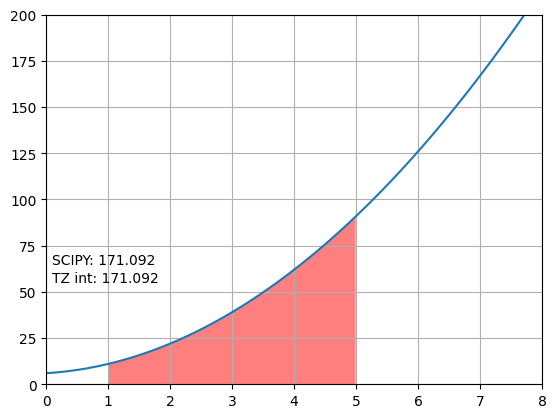
함수의 적분

 1import os
 2os.chdir(os.path.abspath(os.path.dirname(__file__)))
 3
 4import numpy as np
 5import matplotlib.pyplot as plt
 6from scipy.integrate import trapezoid
 7
 8h = 0.01
 9min_x = 1
10max_x = 5
11
12
13def f(x):
14    return 3 * x ** 2 + 2 * x + 6
15
16
17def int_f(func, x_min, x_max, h):
18    output = 0
19    x = np.arange(x_min, x_max, h)
20    for idx in range(len(x) - 1):
21        output += (func(x[idx]) + func(x[idx + 1])) * h / 2
22    return output
23
24
25if __name__ == "__main__":
26    x = np.linspace(0, 8)
27    x_inf = np.arange(min_x, max_x, h)
28    y_inf = f(x_inf)
29    x_inf = np.concatenate(([x_inf[0]], x_inf, [x_inf[-1]]))
30    y_inf = np.concatenate(([0], y_inf, [0]))
31
32    plt.plot(x, f(x))
33    plt.fill(x_inf, y_inf, "r", alpha=0.5)
34    plt.text(0.1, 55, f"TZ int: {int_f(f, min_x, max_x, h):.3f}")
35    plt.text(0.1, 65, f"SCIPY: {trapezoid(f(x_inf), x_inf, h):.3f}")
36    plt.grid(True)
37    plt.xlim(0, 8)
38    plt.ylim(0, 200)
39    plt.savefig("EX3_function_integration.png", bbox_inches='tight')
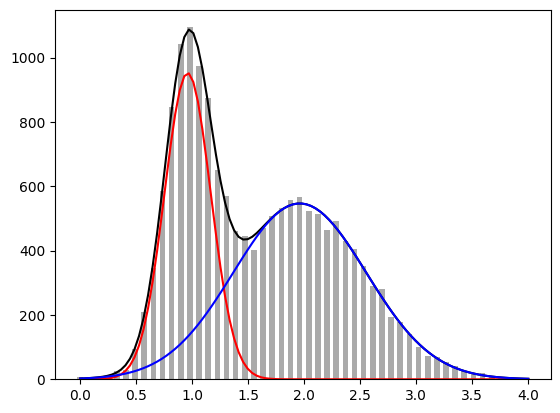
데이터의 적분

 1import os
 2os.chdir(os.path.abspath(os.path.dirname(__file__)))
 3
 4import matplotlib.pyplot as plt
 5import numpy as np
 6from scipy.optimize import curve_fit
 7from scipy.integrate import trapezoid
 8
 9# 데이터 읽어들이기
10bins, count = [], []
11with open("hist_data.csv", "r") as f:
12    for line in f.readlines():
13        _b, _c = [float(i) for i in line.split(",")]
14        bins.append(_b)
15        count.append(_c)
16
17# 모델 함수
18def particle(x, a, b, c):
19    return a * np.exp(-((x - b) ** 2) / (2 * c ** 2))
20
21
22def model(x, a_0, a_1, a_2, a_3, a_4, a_5):
23    p_a = particle(x, a_0, a_1, a_2)
24    p_b = particle(x, a_3, a_4, a_5)
25    return p_a + p_b
26
27if __name__ == "__main__":
28    popt, pcov = curve_fit(model, bins, count, p0=[100, 1, 0.1, 100, 4, 0.1])
29    xdata = np.linspace(0, 4, 100)
30
31    print(popt)
32
33    p_a_value = trapezoid(particle(xdata, *popt[:3]), xdata)
34    p_b_value = trapezoid(particle(xdata, *popt[3:]), xdata)
35
36    print(f"Particle A: {p_a_value:.2f}")
37    print(f"Particle B: {p_b_value:.2f}")
38    print(f"Proportion particle data (A/B): {p_a_value/p_b_value:.3f}")
39    print(f"Proportion particle reference (A/B): {6000/10000:.3f}")
40
41    plt.plot(xdata, model(xdata, *popt), "k")
42    plt.plot(xdata, particle(xdata, *popt[:3]), "r")
43    plt.plot(xdata, particle(xdata, *popt[3:]), "b")
44    plt.bar(bins, count, 0.05, color="#AAA")
45    plt.savefig("EX4_data_integration.png", bbox_inches='tight')