데이터 분석하기
데이터 피팅
온라인을 통해 나사의 연평균기온 데이터를 내려받고 해당 값에 다항식 피팅을 사용하여 근사합니다.
얻은 다항식 계수를 통해 지구 연평균 기온의 추세를 추정하거나 이후 값을 예측하는데 활용할 수 있습니다.
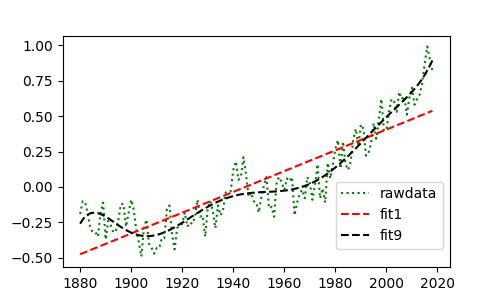
예제는 1차 다항식과 9차 다항식을 사용했습니다. 주제와 상황에 따라 적당한 다항식 근사를 사용하는 방법도 고민해봅시다.
 1import matplotlib.pyplot as plt
 2import numpy as np
 3
 4
 5def get_data():
 6    """
 7    NASA로부터 1880년부터 2019년까지 월별 평균 기온 정보를 받아옵니다.
 8    이 함수는 웹 문서를 읽어오는 패키지인 requests를 사용하며
 9    csv는 쉼표와 줄바꿈문자를 이용해서 데이터를 구분하는 형식입니다.
10    """
11    import requests
12    url = 'http://data.giss.nasa.gov/gistemp/tabledata_v3/GLB.Ts+dSST.csv'
13    data = str(requests.get(url).content)
14    data = data.split('\\n')
15    # \n은 줄바꿈문자. 온라인에서 정보를 받아와서 각 줄별로 리스트를 생성한다
16    data = [row.split(',') for row in data]
17    # 각 줄마다 쉼표로 분리해서 2차원 리스트를 만든다
18    return (data[2:])[:-2]  # 데이터가 아닌 부분은 슬라이싱
19
20
21if __name__ == "__main__":
22    data = get_data()
23    years = [int(row[0]) for row in data]
24    tempr = [float(row[13]) for row in data]
25
26    # 다항식 fitting - 1차
27    fitsp = np.linspace(years[0], years[-1], 100)
28    fit1 = np.poly1d(np.polyfit(years, tempr, 1))
29
30    # 다항식 fitting - 9차
31    fit9 = np.poly1d(np.polyfit(years, tempr, 9))
32
33    # PLOT
34    plt.figure(figsize=[5, 3])
35    raw, = plt.plot(years, tempr, ':g')
36    p1, = plt.plot(fitsp, fit1(fitsp), "--r")
37    p9, = plt.plot(fitsp, fit9(fitsp), "--k")
38    plt.legend([raw, p1, p9], ['rawdata', 'fit1', 'fit9'], bbox_to_anchor=(1, 0.4))
39
40    # 만들어진 그래프 보기
41    plt.show()
42
43    # 만든 그래프 저장
44    # plt.savefig("EX1_data_fitting.png")
오버피팅
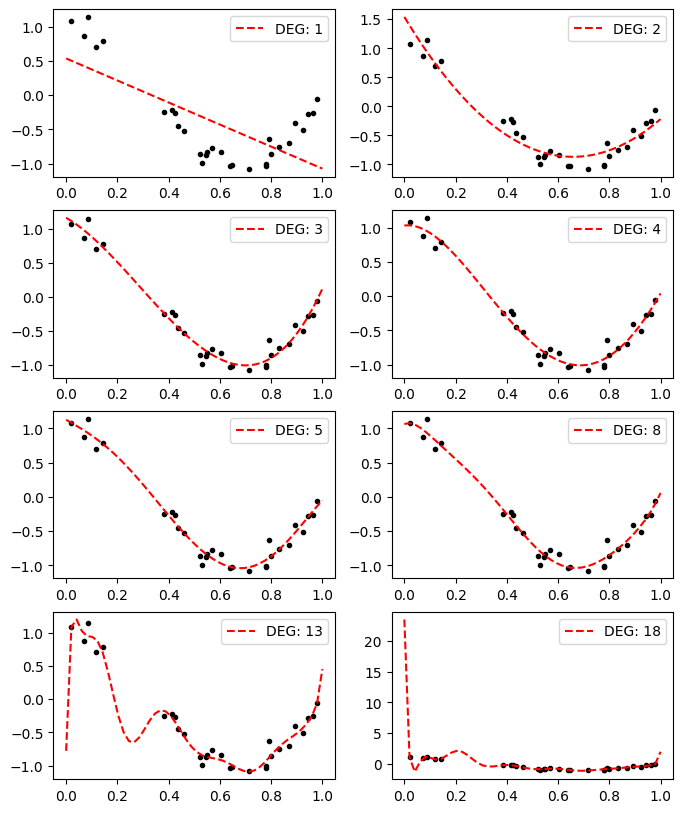
높은 차수의 다항식을 고려할 수록 당장 주어진 데이터와 잘 들어맞는 것 처럼 보이지만 얻은 계수를 토대로 값을 예측할 때는 오히려 더 좋지 않은 추론을 하게 될 수도 있습니다.
예제는 낮은 차수로부터 점점 높은 차수로 피팅한 결과를 그림파일로 저장합니다.
 1import numpy as np
 2import matplotlib.pyplot as plt
 3
 4x = [ 0.0202184,   0.07103606,  0.0871293,   0.11827443,  0.14335329,  0.38344152,  0.41466194,  0.4236548,   0.43758721,  0.46147936,  0.52184832,  0.52889492,  0.54488318,  0.5488135,   0.56804456,  0.60276338,  0.63992102,  0.64589411,  0.71518937,  0.77815675,  0.78052918,  0.79172504,  0.79915856,  0.83261985,  0.87001215,  0.891773,    0.92559664,  0.94466892,  0.96366276,  0.97861834]
 5y = [ 1.0819082, 0.87027612, 1.14386208,  0.70322051,  0.78494746, -0.25265944, -0.22066063, -0.26595867, -0.4562644,  -0.53001927, -0.86481449, -0.99462675, -0.87458603, -0.83407054, -0.77090649, -0.83476183, -1.03080067, -1.02544303, -1.0788268,  -1.00713288, -1.03009698, -0.63623922, -0.86230652, -0.75328767, -0.70023795, -0.41043495, -0.50486767, -0.27907117, -0.25994628, -0.06189804]
 6
 7degs = [1, 2, 3, 4, 5, 8, 13, 18]
 8
 9
10if __name__ == "__main__":
11    plt.figure(figsize=(8, 10))
12    new_x = np.linspace(0, 1)
13
14    for ix, deg in enumerate(degs):
15        ax = plt.subplot(4, 2, ix+1)
16        fit = np.poly1d(np.polyfit(x, y, deg))
17        ax.plot(x, y, ".k")
18        ax.plot(new_x, fit(new_x), "--r", label="DEG: {}".format(deg))
19        ax.legend()
20
21    plt.savefig("EX2_overfit.png", bbox_inches='tight')
이상치
 1import matplotlib.pyplot as plt
 2
 3v = 2
 4a = -0.4
 5
 6def gen_data(x):
 7    y = v*x+a*x*x+np.random.rand(len(x))*0.5
 8    for _ in range(int(len(y)/3)):
 9        y[np.random.randint(0, len(y))] += (np.random.rand()-0.3)*3
10    return y
11
12if __name__ == "__main__":
13    x = np.arange(0, 4, 0.05)
14    y = gen_data(x)
15    fit = np.poly1d(np.polyfit(x, y, 2))
16    std = np.sqrt(np.mean((y-fit(x))**2))
17
18    new_x = []
19    new_y = []
20    for _x, _y in zip(x, y):
21        if np.abs(_y-fit(_x)) < std:
22            new_x.append(_x)
23            new_y.append(_y)
24    new_fit = np.poly1d(np.polyfit(new_x, new_y, 2))
25
26    plt.plot(x, y, '.k')
27    plt.plot(new_x, new_y, '.r')
28    plt.plot(x, fit(x), '--b', label="before")
29    plt.plot(x, new_fit(x), '--k', label="after")
30    plt.plot(x, v*x+a*x*x+0.25, 'r', label='real')
31    plt.legend()
32    plt.savefig("EX3_outlier.png", bbox_inches='tight')
가우스 모델
 1import numpy as np
 2import matplotlib.pyplot as plt
 3from scipy.optimize import curve_fit
 4
 5x = [0.267, 0.533, 0.800, 1.067, 1.333,
 6    1.600, 1.867, 2.133, 2.400, 2.667,
 7    2.933, 3.200, 3.467, 3.733, 4.000,
 8    4.267, 4.533, 4.800, 5.067, 5.333,
 9    5.600, 5.867, 6.133, 6.400, 6.667,
10    6.933, 7.200, 7.467, 7.733, 8.000]
11
12y = [0.143, 0.220, 0.292, 0.315, 0.357,
13    0.577, 0.625, 0.661, 0.619, 0.756,
14    0.643, 1.000, 0.810, 0.792, 0.714,
15    0.726, 0.589, 0.381, 0.369, 0.238,
16    0.244, 0.208, 0.089, 0.060, 0.060,
17    0.060, 0.030, 0.018, 0.012, 0.000]
18
19x = np.array(x)
20y = np.array(y)
21
22def gaussian(x, A, mu, sigma):
23    return A*np.exp(-(x-mu)**2/(2*sigma**2))
24
25
26if __name__ == "__main__":
27    _param, _ = curve_fit(gaussian, x, y)
28    new_x = np.linspace(0, 8)
29    new_y = gaussian(new_x, *_param)
30
31    plt.plot(x, y, '.k')
32    plt.plot(new_x, new_y, '--r')
33    txt = "A {:.2f}\n$\mu$ {:.2f}\n$\sigma$ {:.2f}".format(*_param)
34    plt.text(6, 0.8, txt)
35    plt.savefig("EX4_gaussian.png", bbox_inches='tight')
피크 분석
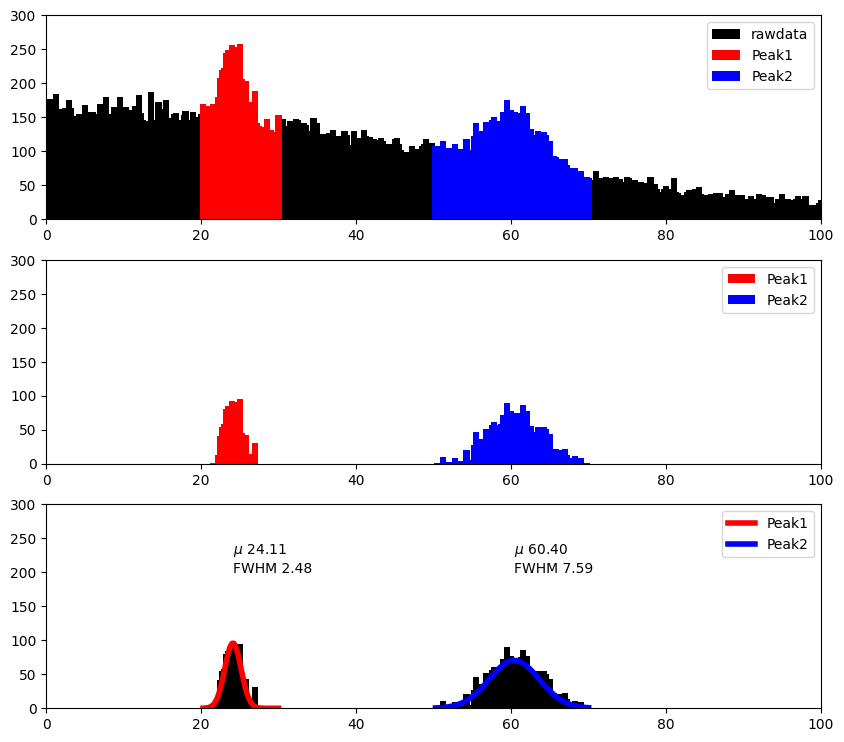
 1import numpy as np
 2from numpy.random import randn
 3import matplotlib.pyplot as plt
 4from scipy.optimize import curve_fit
 5
 6def append(*args):
 7    # 데이터를 합치는 함수
 8    data = np.array([])
 9    for arg in args:
10        data = np.append(data, arg)
11    return data
12
13"""
14Gaussian Fit: 중심점과 반치폭을 찾는다
15"""
16def gaussian(x, A, mu, sigma):
17    return A*np.exp(-(x-mu)**2/(2*sigma**2))
18
19# 데이터 생성
20n = 80000; chn = 400
21back  = randn(n)*50
22peak1 = randn(int(n/50))*1.5+24
23peak2 = randn(int(n/30))*3.5+60
24
25if __name__ == "__main__":
26    data = append(back, peak1, peak2)
27    # 히스토그램 생성
28    hist, ch = np.histogram(data, bins=chn, range=(0, 100))
29    # bins: 채널 수, range: 범위
30    ch = ch[1:]  # 채널 보정
31
32    """
33    예상되는 구간 설정
34    """
35    p1_ch, p1_hist = ch[20*4:30*4], hist[20*4:30*4]
36    p2_ch, p2_hist = ch[50*4:70*4], hist[50*4:70*4]
37
38    plt.figure(figsize=(10, 9))
39    ax = plt.subplot(3, 1, 1)
40    ax.set_xlim(0, 100)
41    ax.set_ylim(0, 300)
42    ax.bar(ch, hist, color='k', label="rawdata")
43    ax.bar(p1_ch, p1_hist, color='r', label="Peak1")
44    ax.bar(p2_ch, p2_hist, color='b', label="Peak2")
45    ax.legend()
46
47    """
48    Background 제거: Background를 1차함수로 가정한다.
49    """
50    p1_bk_fit = np.poly1d(np.polyfit([p1_ch[0], p1_ch[-1]], [p1_hist[0], p1_hist[-1]], 1))
51    p1_hist = p1_hist-p1_bk_fit(p1_ch)
52    p2_bk_fit = np.poly1d(np.polyfit([p2_ch[0], p2_ch[-1]], [p2_hist[0], p2_hist[-1]], 1))
53    p2_hist = p2_hist-p2_bk_fit(p2_ch)
54
55    ax = plt.subplot(3, 1, 2)
56    ax.set_xlim(0, 100)
57    ax.set_ylim(0, 300)
58    ax.bar(p1_ch, p1_hist, color='r', label="Peak1")
59    ax.bar(p2_ch, p2_hist, color='b', label="Peak2")
60    ax.legend()
61
62
63    _param1, _ = curve_fit(gaussian, p1_ch, p1_hist, p0=[150, 25, 1])
64    _param2, _ = curve_fit(gaussian, p2_ch, p2_hist, p0=[100, 60, 2])
65
66    ax = plt.subplot(3, 1, 3)
67    ax.set_xlim(0, 100)
68    ax.set_ylim(0, 300)
69    ax.bar(p1_ch, p1_hist, color='k')
70    ax.bar(p2_ch, p2_hist, color='k')
71    ax.plot(p1_ch, gaussian(p1_ch, *_param1), "r", label="Peak1", lw=4)
72    ax.plot(p2_ch, gaussian(p2_ch, *_param2), "b", label="Peak2", lw=4)
73    p1_tx = "$\mu$ {:.2f}\nFWHM {:.2f}".format(_param1[1], _param1[2]*2.3548)
74    p2_tx = "$\mu$ {:.2f}\nFWHM {:.2f}".format(_param2[1], _param2[2]*2.3548)
75    ax.text(_param1[1], 200, p1_tx)
76    ax.text(_param2[1], 200, p2_tx)
77    ax.legend()
78
79    plt.savefig("EX5_peak.png", bbox_inches='tight')